India secured memberships to two influential United Nations committees on data and statistics, a significant step forward in the country’s role in international data governance. The country will now play a crucial role in developing tools and strategies that national statistical offices across the world can adopt.
After a prolonged gap, India has gained a seat at the United Nations Statistical Council. It has also been selected for the UN-CEBD (UN Committee of Experts on Big Data and Data Science for Official Statistics).
Through these appointments, India will actively contribute to establishing norms for utilizing big data and AI technologies. This includes outlining best practices and new methodologies for measuring key indicators of rural development, trade, economic growth, and sustainability. Furthermore, the country will help create globally harmonized models for geospatial data, environmental-economic accounting, and demographic statistics.
India plans to showcase its innovative initiatives, such as the Data Innovation Lab, which explores using satellite imagery and machine learning for policymaking. The country’s involvement in these panels highlights its expertise in data and technology and its commitment to improving data collection methods and accessibility.
The international recognition also comes at a time when the country has been enhancing its own statistical systems. The Ministry of Statistics and Programme Implementation, led by Saurabh Garg, has been driving changes to regulate data across ministries and states. This will ensure that India’s data is reliable, consistent, and comparable to international standards.
These domestic reforms, along with India’s nomination at a global scale, have positioned the country as a leader in renewing the future of data science.
OpenAI, an American AI research platform, is about to unveil a revolutionary breakthrough: AI super-agents with PhD level of expertise. Unlike previous models, the upcoming super-agents don’t just respond to a single command; they mimic PhD-level human intelligence to complete a goal-oriented task. For instance, by instructing the agent to build a new payment system, it could design, test, and deliver a fully functional product.
With the exclusive development of an AI agent, industries can perform complex tasks autonomously with minimal to no human intervention. These agents can make decisions, adapt to various situations, analyze vast amounts of data, and consider multiple options, all autonomously.
Initially, there were speculations about the release of OpenAI’s GPT5, but recent reports indicate the company is shifting its focus to AI super-agent development. This change is backed by a blog post written by OpenAI CEO Sam Altman last week. He stated, “We believe that, in 2025, we may see the first AI agents join the workforce and materially change the output of companies.” Several reports suggest these next-generation AI agents could launch as early as January 30, 2025. However, the official release date is yet to be confirmed.
Recently, Axios, a US news page, claimed that the OpenAI CEO has scheduled a private briefing with US government officials on January 30 in Washington. The primary goal of the rumored meeting appears to be discussing the impending launch of the AI super-agents. During the conference, Altman may also outline the plans to integrate advanced AI systems into the US economy, as described in OpenAI’s latest economic blueprint.
When AI agents become a reality, they can bring optimism and significant concern. While AI has the potential to improve productivity and efficiency drastically, one of the most widely discussed implications is job displacement. By managing routine, repetitive, and even strategic activities, AI applications could reduce the need for manual roles. As a result, industries like manufacturing, transportation, and customer service may see a significant reduction in human workforce requirements.
However, while mass layoffs are a concern, AI also creates opportunities for new roles in fields such as data science and AI maintenance. The impact on employment will depend on factors like the pace of AI adoption, workers’ ability to reskill, and policies that support workforce transitions. Ultimately, the challenge is ensuring that AI’s benefits are leveraged without leaving workers behind.
OpenAI recently developed a new AI micro model, GPT-4b, in collaboration with Retro Biosciences, a longevity startup, to improve the efficiency of stem cell production.
In the past, the contribution of AI in bioengineering was limited to the prediction of protein structures by Google’s Deepmind. However, this model is supposedly said to enhance longevity science, expanding the horizons of life beyond the threshold limit.
The GPT-4b model, as claimed by researchers at OpenAI, can visualize proteins that are capable of transforming regular cells into stem cells. Custom-built for biological research, this model is expected to streamline the Yamanaka factor, a protein that modifies human skin cells.
The Yamanaka factor represents four special genes that can significantly optimize cellular operations. It is responsible for resetting a cell to its factory settings.
Backed by Sam Altman—CEO of OpenAI—Retro, Biosciences looks forward to developing regenerative medicine that can supply cell replacement to combat age-related diseases.
The GPT-4b model is trained on various protein species and how proteins interact inside a living body. Although the training is conducted on massive datasets, this model is comparatively smaller than other OpenAI models, making it a small language model (SLM).
According to the MIT Technology Review Report, it has been almost a year since Retro Biosciences reached out to OpenAI for this protein engineering project. Sam Altman is said to have already funded a total of $180 million to support Retro Biosciences’ purpose of biological enhancement.
This project aims to revolutionize artificial general intelligence (AGI), broadening the domain of AI applications to medicine.
The consumption of high-quality visual content has increased tremendously with the advent of social media. Different sectors, such as real estate, tech companies, educational institutions, or NGOs, have some form of social media presence for self-promotion. These organizations have dedicated social media teams that create different kinds of text, audio, or visual content, of which images are an integral part.
However, it has become difficult for organizations to stand out in the crowded social media marketing landscape. This is where AI image generators can be useful, as they automate the creation of unique and specific images using artificial intelligence. Let‘s try to understand how AI image generators work and look at some of India’s best AI image generators.
An AI image generator is a tool that uses artificial intelligence and machine learning models to create images. You can give text, image, or audio input to these platforms, and they will quickly generate a picture as per your imagination. AI allows you to quickly produce images that may or may not be close to reality. For example, you can give a text prompt to an AI image generator tool to create an image of a dog reading a book, and it will generate the required output image.
You can use the AI image generator solutions to edit your images by changing features like color, brightness, contrast, or size. Some AI-powered image generators also offer inpainting and outpainting services to help you add missing elements or extrapolate additional elements in an image. You can create abstract, animated, or realistic images by opting for a wide range of filters and effects provided by an AI image generator.
How Do AI Image Generators Work?
An AI image generator’s workings are based on neural networks (NN), a machine learning model consisting of artificial neurons mimicking biological neurons. Each neuron processes information and transfers it to the next neuron. All the neurons are connected to each other to form layers, which are categorized as input, hidden, and output layers.
As data moves through layers, the NN model learns to recognize patterns and features more precisely. Initially, the model identifies simple shapes and edges. When the input data moves through further layers, the models begin to understand more complex patterns like textures and colors.
You can fine-tune the NNs through a process called backpropagation, in which the model improves its outcomes based on earlier generated errors. Through continuous learning and fine-tuning, the NNs become efficient in producing accurate outputs.
Generative adversarial networks (GANs) have now become an integral part of AI image generators. GANs are unsupervised machine learning models comprising two neural networks: generator and discriminator. These models can generate artificial data identical to actual training data.
The generator creates images and tries to make them as realistic as possible. On the other hand, the discriminator compares these images to real images to check their authenticity and gives feedback to the generator. Using this feedback, the generator improves its functionality over time, producing highly refined images.
Top AI Image Generators in India
The AI generators are continuously evolving, simplifying the image generation process. Here are some of the best AI image generators in India that you can use to create your customized images in minutes:
DALL-E3 is a popular AI image generator tool that helps you create high-quality images using text prompts. It is built on ChatGPT, the widely used AI chatbot developed by OpenAI. You can utilize ChatGPT while using DALL-E3 to get more refined prompts specific to your image requirements. You do not need permission from OpenAI to reprint, sell, or merchandise images you create with DALL-E3.
DALL-E3 has ensured that it limits the creation of images that are violent, adult, or hateful to promote the responsible use of AI. The platform is also testing an internal tool called provenance classifier to detect images generated using DALL-E3.
Adobe Firefly, a product offered by the well-known software company Adobe, is a realistic AI image generator. This tool allows you to create highly artistic images by giving text prompts to its browser-based interface. You can streamline your images further by providing additional prompts to change the style, brightness, or color composition.
The Firefly AI model is the primary reason behind Adobe Firefly’s high efficiency. This model is trained on licensed images from Adobe Stock and public domain content. The latest Adobe Firefly Image 2 model understands text prompts better and recognizes cultural symbols. It offers a prompt guidance feature to help you auto-complete and write correct prompts to produce better images. As a result, you can utilize the Adobe Firefly Image 2 model to develop highly creative AI-based images.
Canva is a graphic design platform that assists you in developing interactive visuals and graphics for diverse purposes. It supports AI image generation apps like Magic Media, Imagen by Google Cloud, and DALL-E by OpenAI to facilitate AI-powered image generation.
All these apps are integrated into Canva, and you just have to enter text prompts in the platform’s interface to create your desired AI images. This saves the time required to search for the right, license-free images to enhance your reports and presentations. You can also crop, resize, flip, or add frames to your images using Canva’s built-in photo editor. Smaller artists and art students can use this free AI image generator solution to experiment with their assignments without worrying about budget.
Canva recently acquired Leonardo.AI and has used it to create a new AI image generator tool called Dream Lab. Leonardo AI is an AI-powered solution that allows you to create superior content by automating image and video generation. It utilizes the Phoenix AI model, which accurately follows your text prompts to produce exact image outputs. The platform also offers an Edit with AI feature to help you quickly edit images by giving short phrases as prompts.
Midjourney is a generative AI solution that enables you to create innovative visuals by giving text prompts to a bot. You can interact with this bot on the Midjoureny Discord server, or you can add the bot to your own Discord server.
Midjouney’s work is powered by LLMs and diffusion models. When you give Midjourney a prompt, the diffusion model adds it to its training image datasets. These prompts may contain some noise, which the model accepts and then reconstructs a new dataset by removing noise in reverse. The new dataset enables Midjourney to generate more accurate images aligned with the input prompts.
Ideogram is a free AI mage generator from text that helps you create innovative images, logos, and posters. It offers a ‘Magic Prompt’ feature that rectifies your prompts to make them more specific for accurate image creation. Ideogram allows you to create logos in different styles, such as graffiti, illustration, 3D rendering, or typography.
When you go to the Ideogram website, you will see some images that the platform had created earlier. You can edit and reuse these images according to your requirements. The platform offers four variants of an image, and you can select any of these and refine them further.
Factors to Consider While Choosing an AI Image Generator
AI image generators have transformed the process of creating visual content, making it more accessible. You can easily create desired images using AI tools whether or not you have an inherent creative talent. However, there are several AI image-generating tools, and to choose an effective tool, you need to consider the following factors:
Ease of Use
While selecting an AI image generator, you should consider how user-friendly the tool is and how easily you can integrate it into your existing workflow. Software with a simple interface is usually easy to navigate. You should look out for the availability of documentation as it helps you understand the functionalities of the tool. It is also beneficial if the platform has a strong user community that actively responds to your queries if you encounter any issues while using the image generator tool.
Customization Options
Ensure that the AI image generator you use offers several customization features, including various color palettes, styles, effects, and compositions. Adjusting these elements enhances the appearance of your images.
Output Quality
Choose tools that help you produce high-resolution and professional images. High-quality images appeal to the audience, increasing your content engagement. This also gives you a competitive advantage among the community of similar creators.
Cost and Licensing
You can opt for free or paid AI image generators after reviewing whether their price structure aligns with your budget. Some of these tools offer free trials, which you should utilize before investing your money. You should also ensure that the software allows you to use the images commercially, which might be essential for some of your projects.
Final Thoughts
AI image generators have emerged as an effective solution to boost creativity and efficiency among creators and amateur artists. This blog provides comprehensive information on what AI image generators are and how they work. It also enlists some of the top AI image generators used extensively in India by content creators to elevate their craft. You can choose an AI image generator from this list to create images according to your requirements for social media posts or marketing campaigns.
FAQs
What is the Difference Between Image Sourcing and AI Image Generating Tools?
Image sourcing tools help you search for and download images already available on the Internet. Some examples are Pixabay, Freepik, and iStock. On the other hand, AI image-generating software enables you to create a new image from scratch, depicting visuals that may or may not exist in reality.
Can AI art be copyrighted?
No, AI-generated art cannot be copyrighted. Unlike human artists, AI image generators are not the actual creators but are trained on image datasets produced by humans.
For your organization to function efficiently and smoothly, all departments should share a unified data view. Working with incomplete data can lead to inconsistent, unreliable insights and unnecessary internal conflicts. This disconnect in communication can happen due to data silos. In this article, you will explore what data silos mean, how they can pose a problem for your organization, and how you can break them down.
What Are Data Silos?
Data silos refer to isolated data collections that are accessible to specific departments within your organization but not easily shared with others. It happens when teams collect, store, and manage their data independently, using separate systems or tools. This results in the fragmentation of crucial information and a lack of data visibility and transparency across the organization.
Without an integrated data infrastructure, your departments risk working with outdated data, leading to poor decision-making and missed opportunities. Data silos can make it difficult for you to pinpoint patterns, trends, and insights that could drive innovation and growth. They hinder strategic planning and increase operational costs due to poor data quality, redundant data storage, inefficient processes, and the need for manual data reconciliation.
What Are the Causes for Data Silos?
Data silos occur due to a combination of organizational, technological, and cultural factors limiting the free flow of information. This can significantly impact the collaboration between your departments and the organization’s operational efficacy. Here are several reasons that can cause data silos:
Mergers and Business Growth
As your organization expands or undergoes mergers, news departments will be formed with their own data needs and workflows. This can make consistent data sharing a challenge, contributing to the formation of data silos. Additionally, acquiring a business introduces new data systems that may not fully integrate into your organization’s existing infrastructure, increasing the risk of data isolation.
Organizational Structure and Competitive Gatekeeping
When teams within your organization operate independently, each with its own goals, resources, and data systems, it can lead to departmental silos and restricted data access. Additionally, internal competition can further worsen this issue, with teams hoarding data to maintain control or gain an advantage. This lack of collaboration between your organization’s hierarchies can slow down the flow of information and negatively impact the overall business performance.
Data Governance Policies
While data-driven governance policies are essential for ensuring data quality and security, they can unintentionally contribute to siloed data practices. If different departments have different rules for collecting, storing, and accessing data, it can create barriers to data sharing. For example, legal or compliance teams might restrict access to sensitive data due to privacy concerns.
Technological Issues
Relying on outdated legacy systems is another major cause of data silos. If your organization continues using legacy systems that were implemented when data integration wasn’t a priority, it might be difficult to overcome this issue. This is because older technologies often lack the capacity to connect with advanced data-sharing tools.
Sometimes, even modern applications might not be compatible or designed to communicate across platforms, preventing your teams from effectively sharing or cross-referencing data. Furthermore, using different technologies across different departments will only complicate your efforts to avoid data silos.
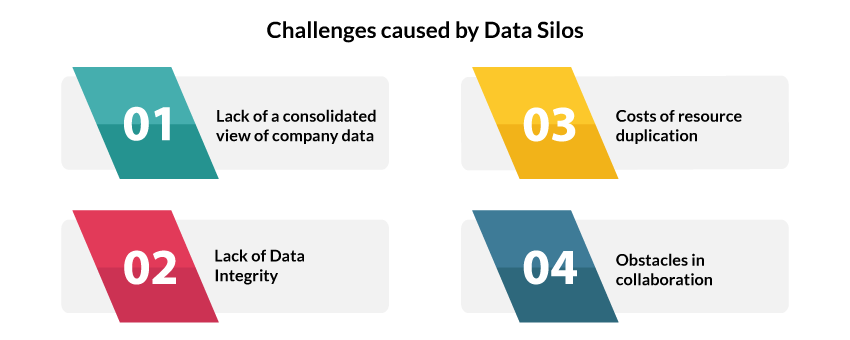
Data silos can create several challenges for your organization in the long run. Here are some key issues that you might have to deal with:
Duplication of Efforts and Dropping Productivity: When your teams don’t share data, they might end up making redundant efforts to collect the same information separately. This duplication wastes time, effort, and resources, as the same data is gathered and processed multiple times. Additionally, when each department collects and updates information at different times or in different ways, the chances of data discrepancies also increase.
Incomplete Data View: Data silos prevent you from having a 360-degree view of your data assets. Without proper context and insights, making crucial business decisions and strategies can be damaging. You might also lose the opportunity to fully understand your customer behavior, forecast trends, and reduce operational costs.
Compromised Data Quality and Integrity: Data silos can cause inconsistencies in data definitions, formats, and quality standards. This can compromise your data’s accuracy and reliability, leading to misleading reports, analyses, and interpretations. Over time, your stakeholders and clients might lose their trust in your data, creating huge losses for the organization.
Poor Collaborative Environment: Having data silos can make your work environment fragmented and uncoordinated, causing issues with teamwork and knowledge sharing. For example, the product development team may not fully understand customer needs because they aren’t aligned with the marketing team’s insights on customer behavior. This can create bottlenecks in the process of making innovative solutions that can potentially meet the market demands.
Security Threat and Non-Compliance: When you store data in isolated systems, enforcing consistent security policies across the organization becomes more difficult. With varying levels of data protection, some silos can be more vulnerable to data breaches, and complying with regulations like GDPR or HIPAA becomes challenging. If sensitive information is mishandled or exposed, it can lead to massive penalties and reputational damage.
Limiting the Use of Advanced Technologies: Conducting advanced analyses, such as predictive data modeling, requires training AI or ML models on large and diverse datasets. However, isolated data limits your organization’s ability to leverage these models effectively.
How to Identify Data Silos Exist?
One of the first signs of a data silo is inconsistent or conflicting information across departments. If your teams report different metrics or customer insights, it’s a strong indicator that they work from separate datasets. This can lead to confusion, misinformed decisions, and a lack of a unified understanding of your customers and business operations.
Another sign is difficulty accessing data across departments. If your teams struggle to share data or collaborate due to incompatible systems or limited access permissions, it indicates that data silos exist.
Lastly, entering and updating the same information in multiple systems also hints at the presence of data silos. It shows that your systems are not integrated and lack transparency about your existing data assets, increasing the risk of operational inefficiencies and lost opportunities.
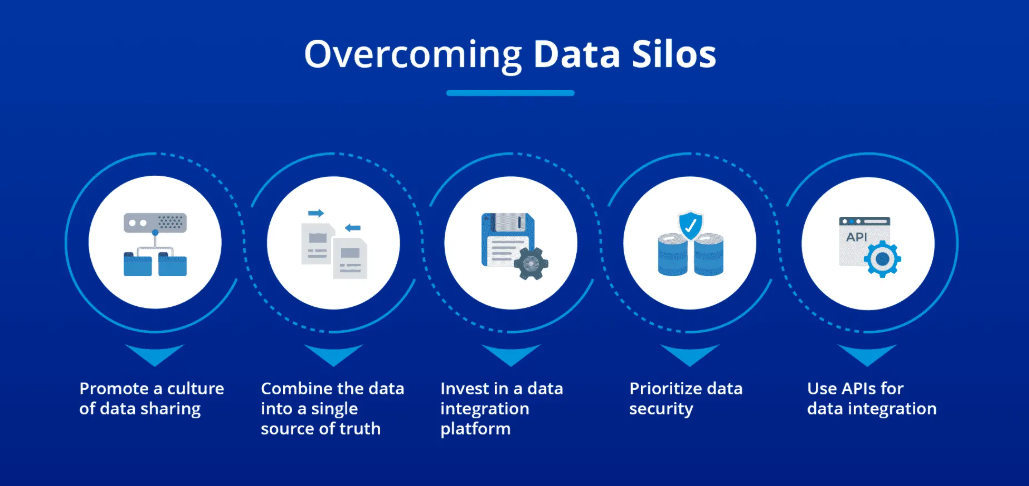
Breaking down data silos involves a combination of technology, processes, and cultural changes within the organization.
Adopt Integrated Data Solutions
You should start implementing integrated software platforms such as enterprise resource planning (ERP) systems, customer relationship management (CRM) systems, or data lakes. These tools can help you unify data from multiple departments. You can also use cloud-based data solutions to centralize storage and accessibility.
Standardize Data Practices
You can appoint a data steward or data management team to develop uniform data management policies for all departments. Their job includes setting consistent standards for data entry, categorization, and reporting so that all teams can easily access and interpret shared information.
Promote Data Literacy
Your organization can invest in training your employees on the importance of data and how to use it effectively. This will enable you to foster a culture of data sharing and collaboration, promote data literacy, and ensure the staff is comfortable with modern technologies.
Monitor, Review, and Refine
This step involves continuously monitoring and evaluating the effectiveness of your data silo-breaking initiatives. You can conduct an audit, get employee feedback, and address any emerging challenges or bottlenecks.
Closing Thoughts
Having data silos can massively compromise the quality of your data, analyses, and reports. It can further lead to missed growth opportunities and wrong business decisions. To overcome this hurdle, you must facilitate data literacy and a culture of collaboration among teams.
By adopting integrated technology, standardizing data practices, and establishing a governance framework, you can maximize the utilization of your data assets. Overcoming silos not only improves operational efficiency but also enables better decision-making and enhanced customer insights, resulting in continued growth and success of your organization.
Artificial Intelligence (AI) is slowly becoming an important part of your everyday life. It has found diverse applications in prominent industrial sectors and businesses. According to a Statista report, the AI market will grow to more than 1.8 trillion USD by 2030. As a result, knowing the strategic ways to gain maximum benefits from AI has become imperative.
Let us try to understand practices of maximizing AI impact across different domains. This will help you to use AI optimally in your organization while fostering innovation and business growth.
Practices that You Should Adopt to Maximize AI Impact
To expand the use of AI across your organization, you should adopt certain measures as best practices. Here are a few things you can keep in mind for efficient AI impact:
Effective Data Preparation
You should frame a robust data preparation strategy to utilize AI to achieve organizational goals. This involves proper data extraction and cleaning before it is loaded into any centralized storage system. You should also check for duplicate, missing, and outlier data points to ensure that the data on which the AI model is trained is error-free.
Simplified Deployment
Before you deploy AI applications in your current workflow, check how easily they can be integrated into your existing infrastructure. You should also assess resource requirements, scalability needs, and the cost of deployment.
Correct Model Selection and Training
Models are the critical component of AI-based software. They are trained on large datasets to recognize patterns for making decisions or predictions without human intervention. As a result, it is important that you train your organization’s AI models correctly on unbiased and representative datasets. You should also carefully test the models and monitor their outcomes to fine-tune them for accuracy and precision.
Upskill Current Teams or Hire Experts
Design training programs to help your employees learn how to use AI in their work. Encourage them to come up with new ideas through experimentation and innovation. You can also hire an additional expert workforce if you have the monetary capacity.
Ethical Considerations
You should promote the responsible use of AI within your organization. First, clearly define the objectives that you want to achieve through the use of data and AI technologies. Then, ensure that relevant data is collected from varied sources. This is essential to form an inclusive dataset that yields outcomes that align with your organizational strategy.
Gathering data from reliable sources is a good practice, as it helps you substantiate decisions made by your AI models, fostering accountability. You should also comply with all data regulatory and privacy frameworks to protect sensitive data from cyberattacks.
To effectively utilize AI, it is essential to understand the areas where you can effortlessly integrate AI. Let’s discuss some sectors where you can use AI to create a higher impact:
Healthcare Sector
You can use AI in the healthcare sector for the following purposes:
Medical Imaging: AI allows you to accurately analyze X-rays, CT Scans, and MRI reports. This helps in correct diagnosis and treatment, especially for serious diseases like cancer.
Remote Patient Care: Providing medical services remotely using AI software is now possible. For example, AI-powered blood pressure monitoring tools assist in distantly analyzing a patient’s heart rate or blood pressure. The software’s AI models compare this data with historical data to understand the symptoms and predict heart diseases. You can utilize this advantage of AI to treat patients in rural and remote areas with limited medical infrastructure.
Better Management of Medical Records: You can use AI-based OCR software or voice-to-text systems in hospitals to automate data entry and patient data management. Patient categorization tools like ZS help you classify patients based on diseases or treatment plans. Through such technologies, you can streamline the hospital’s workflow, ensuring good medical treatment for patients.
E-commerce
You can utilize AI in the e-commerce sector through the following features:
Dynamic Pricing Facility: AI tools like dynamicpricing.ai can help you detect real-time market conditions, changes in demand, and competitor product pricing. You can use this information to adjust your product pricing, generate more revenue, and optimize your sales according to market situations.
Personalized Customer Experience: You can use AI to analyze and identify patterns in customer preferences, behavior, and purchase history. This gives you a better understanding of customers’ needs, based on which you can suggest personalized products.
Inventory Management: AI software such as C3 AI can track changes in demand and inform you whether you need to restock or destock your inventory. You can utilize this to ensure supply chain efficiency and optimize expenses in case of demand reduction.
Banking and Financial Services
AI should be amplified in the following areas of the banking industry:
Fraud Detection: You can utilize tools such as Resistant AI or Hawk AI to identify unusual patterns in monetary transactions and detect fraudulent practices. Such automated tools provide faster results than manual methods. Using AI fraud detection tools, you can prevent financial loss and improve customers’ experience and trust in financial institutions.
Risk Assessment: Kensho and AlphaSense are a few AI-based solutions that facilitate quick assessment and prediction of market conditions. Such information is useful for banks to change loan interest and repo rates to control inflation and maintain an economic balance.
Portfolio Management: Algorithmic trading platforms allow you to track market trends and select assets for your portfolio to avoid financial losses. These tools also suggest you retain or sell any asset depending on your risk appetite and long-term gains.
Supply Chain and Logistics
In supply chain and logistics management, AI simplifies the following tasks:
Tracking Shipments: You can leverage AI to track your order shipments and schedule further downstream operations. AI solutions like DispatchTrack suggest routes with the least traffic and send timely alerts in case of delays, ensuring fast delivery operations.
Demand Forecasting: AI technology assists you in analyzing data related to seasonal trends, historical data, and economic indicators. Using these predictions, you can calculate the amount of stock that you will have to supply to retailers or customers. This helps you produce or place orders in manufacturing units in advance to ensure efficient supply chain management.
Reverse Logistics Management: Reverse logistics is the process of calling back products from the customers or point of sale to manufacturers. This is usually done to repair, refurbish, or recycle any product. AI can help you manage these processes by predicting the goods that can be returned based on seasonal trends. You can also use AI to asses and sort products across refurbish, recycle, or disposal segments.
Education
AI is transforming the education sector, making it more accessible and tailored according to students’ requirements. It is also helping teachers with administrative tasks, freeing them up to sharpen their teaching skills. Here are ways in which you can use AI in the education sector:
Personalized Learning: You can use AI tools like Knewton or DreamBox to analyze student data, such as their grades. This tells you the subjects they have scored well in and where they need to improve. With this information, you can design a personalized curriculum for students based on their strengths and weaknesses.
Automated Grading: Teachers can use AI to speedily check assignments, quizzes, and exams. They can use their free time to focus more on teaching and paying attention to students’ learning needs.
Interactive Language Learning: AI software can simplify learning a new language by giving you instant feedback on pronunciation, grammar, and spelling errors. This makes the learning process highly interactive and reduces the learning curve.
Media Industry
AI has revolutionized the media industry by automating several content generation and consumption procedures. Let’s see how AI has impacted the media industry:
Data-based Journalism: Using AI, you can make your journalistic work more credible by backing it up with data. There are several AI software that automate the process of data collection, cleaning, and analysis to provide useful insights for your news story. You can also perform sentiment analysis on any public issue by analyzing social media data.
Automated Editing: AI-based image and video editing software can assist you with color correction, cropping, background removal, or resizing techniques. This helps improve viewers’ visual experience and the art of storytelling.
Content Recommendation: Streaming platforms like Netflix use AI to suggest personalized content based on your watch history. AI also helps streaming services send recommendations based on location or time of day. For example, a music app may suggest relaxing music at night for peaceful sleep.
Challenges in Amplifying AI Impact
The advancement of AI has truly streamlined workflows in different industries, and in the future, too, it will impact your lives positively. However, there are some challenges that you may face while implementing AI:
Absence of Skilled Workforce
AI technology is still comparatively new and in developmental stages. As a result, a skilled workforce with expertise in data collection, preparation, and model training techniques is lacking. Even though many people are now opting for careers in AI, there is still a huge gap in the demand and supply of domain-specific professionals.
Biased Datasets
Biased datasets can lead to negative AI impacts on society. Such datasets are not representative, and the models trained on them generate inaccurate results. This can lead to ethnic discrimination, gender prejudices, unfair hiring practices, and loss of credibility.
Unbalanced AI Regulations
Regulatory frameworks such as GDPR or HIPAA can sometimes pose stringent restrictions on data accessibility. As a result, you may not be able to fetch quality data to train your AI models. On the contrary, a lack of robust regulations can sometimes lead to data breaches and cyberattacks. So, it is essential to have a common and balanced regulatory framework to ensure the productive use of AI globally.
Lack of Accountability
Holding any specific authority accountable becomes difficult when an AI system fails or generates inaccurate results. This kind of situation delays troubleshooting, affecting critical services like medical diagnosis, financial fraud detection, and the insurance claiming process.
Misconceptions that AI Will Kill Jobs
Most people think that increased AI impact on jobs will lead to unemployment in a large workforce. In contrast, AI will aid human productivity through automation. However, as AI technology is still developing, you cannot fully convince people about its final consequences.
Higher Cost of Implementation
The high development and infrastructure cost makes it difficult for smaller businesses to adopt AI. Even if you make a one-time investment for long-term gains, maintaining AI workflows is expensive. Professionals such as AI engineers or data scientists demand very high salaries due to the limited availability of skilled experts. This further increases the implementation cost.
Conclusion
Maximizing AI impact at social, economic, and individual levels is critical for its effective usage. However, you should also consider practices that ensure the ethical and responsible use of AI.
This blog gives you comprehensive information on encouraging the impactful application of AI through best practices. It also explains the challenges you may face while implementing AI for innovation and growth. This will help you understand how AI is currently being used across various industries and how its application can be increased further.
FAQs
What is the impact of AI on business operations?
You can use AI technology to streamline various operations and business workflows. It can automate most of the repetitive processes and optimize data-related tasks. This enhances innovation and improves decision-making and overall efficiency of business organizations.
Is AI more beneficial or harmful?
You cannot say absolutely that AI is good or bad. AI has positively transformed various industrial areas. However, the challenges, such as lack of transparency, biases, and threats to personal data, can pose significant dangers.
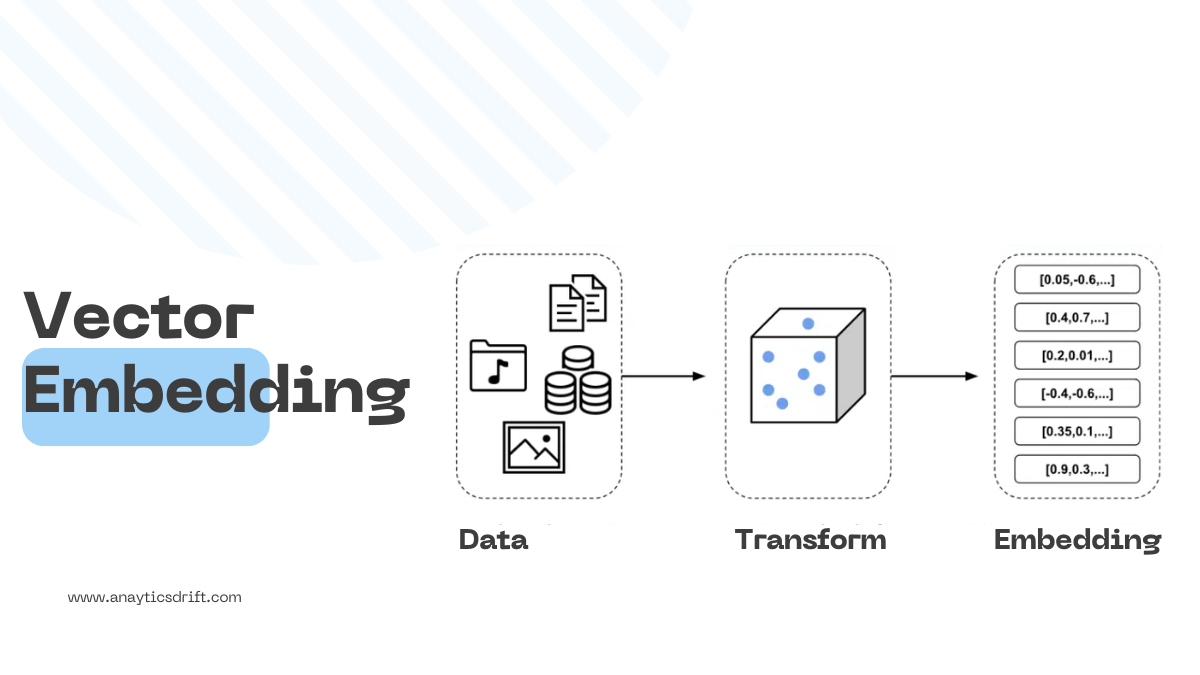
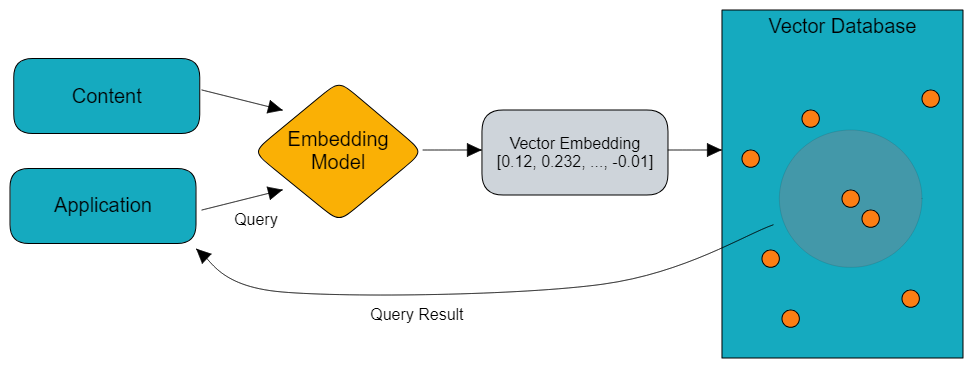
Machine learning models, from simple regression to complex neural networks, operate on mathematical logic. For these models to function effectively, all data, whether text, audio, or image, must be converted into numerical format. This allows the models to accurately analyze the data and predict outcomes. A vector embedding is a method of representing data as an array of numbers while preserving the original meaning and context of the data.
These embeddings facilitate efficient data processing by enabling the ML models to capture relationships and similarities among different data points. In this article, you will learn about vector embeddings, how you can create an embedding, and the diverse use cases.
What are Vector Embeddings?
To comprehend the concept of vector embeddings, it is important to first understand vectors in the context of machine learning. A vector is a data point that represents both direction and magnitude, similar to coordinates on a map. These vectors define the characteristics and features of the data types they represent.
Vector embeddings are structured arrays of numbers that capture significant information about data. These numerical representations contain key features of the original data and are processed by ML models to perform tasks such as classification and clustering. You can also use these embeddings to make predictions based on the relationships between these vectors in a numerical space. With this, models can determine the similarities or differences among data points, which is essential for making informed predictions and decisions based on the data.
Types of Vector Embeddings
You can represent different types of data in the form of vector embeddings. These vectors are used in NLP tasks and help you create solutions like chatbots, advanced language models like GPT-4, and generative image processors.
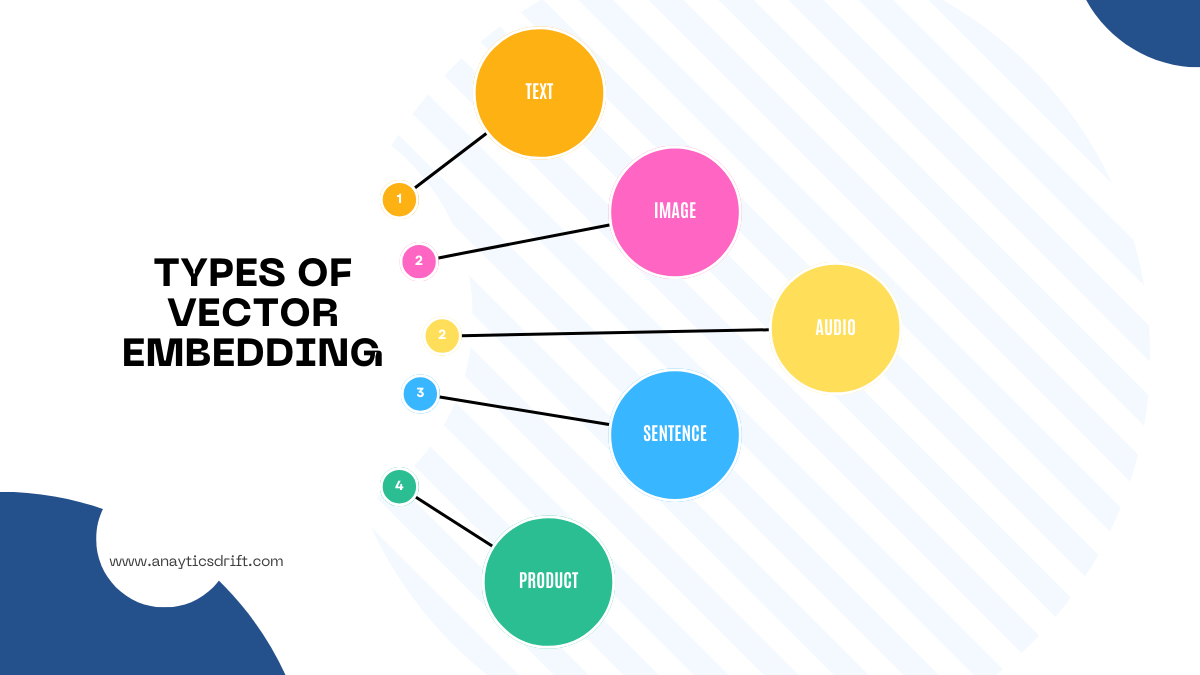
Here are some common types of vector embeddings, each used for different purposes:
Text Embedding
Text embedding is a technique to convert text into numerical vectors, capturing the text’s meaning and context. It is a way to transform unstructured text into vector data points that can be quickly processed by machine learning models. Text embeddings are useful for tasks such as search and information retrieval, question-answering systems, document clustering, text classification, language modeling, and synonym generation.
Here are some of the common types of text embeddings:
Word Embeddings: These embeddings represent individual words as vectors in a high-dimensional space, clustering similar words together. You can generate word embeddings using techniques like Word2Vec, GloVe, and ELMo, each catering to specific requirements.
Document Embeddings: Document embedding is where you embed and capture the overall semantic meaning of the entire document. These embeddings allow ML models to understand concepts and relationships within a document rather than just focusing on specific words. Tools like Doc2Vec or Sentence-BERT can help generate these embeddings.
Image Embedding
Image embeddings refer to the process of converting images into numerical vectors. From a full image to individual pixels, image embedding provides the ability to classify the features of an image mathematically for analysis.
You can use techniques like convolutional neural networks (CNNs) or pre-trained models like VGG and ResNet to generate image embeddings. These embeddings are used for classification, object detection, and image similarity assessment.
Audio Embedding
Audio embedding represents audio data in vector format. To generate audio embeddings, you extract features, such as pitch, tone, or rhythm, from audio signals. These features are then represented numerically for processing by ML models.
Using audio embedding, you can develop systems like smart assistants that understand voice commands. These systems can detect features and emotions from spoken words.
Audio can be embedded using techniques like recurrent neural networks (RNNs) and CNNs. RNNs can capture temporal dependencies in audio sequences. On the other hand, CNNs help analyze audio spectrograms, treating them like images and extracting spatial hierarchies of features.
Sentence Embedding
Sentence embedding involves representing individual sentences as vectors that capture their meaning and context. These embeddings are helpful in tasks requiring nuanced sentiment analysis.
By encoding the semantic information, the embedding can be used to compare, classify, and derive insights from textual data. These insights can be utilized for applications like chatbots and content moderation, helping them analyze languages more accurately.
Product Embedding
Product embeddings represent products as vectors capturing features, attributes, or other semantic information. Various e-commerce sites use product embeddings to analyze a customer’s behaviors and purchase patterns and provide recommendations based on semantic similarities.
For example, if a customer buys a specific shirt, the system can recommend similar shirts or complementary items like pants.
How to Create a Vector Embedding?
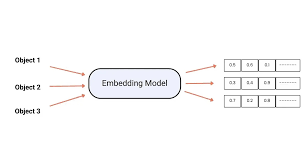
Creating vector embedding involves transforming discrete data points like words, images, or objects into numerical vectors. These vectors represent data features in a high-dimensional space, capturing similarities and relationships between the data points.
Let’s take an example of creating a vector embedding for movies based on their genre. Consider these three movies: Inception, Lion King, and Nemo. These movies have differing characteristics, like action, animation, and adventure. You can assign values to these features.
Inception is a sci-fi movie with no animation and mostly adventure and action. You could represent its vector value in a 3D space as [Action: 2, Animation:0, Adventure: 3] or simply [2,0,3]. Similarly, you can assign values to Lion King and Finding Nemo based on their characteristics.
After assigning values, you represent the values in a 3D space. You will find that Lion King and Finding Nemo have more semantic similarities in terms of animation and adventure than Inception.
The example above uses 3-dimensional space, but in practice, a vector embedding spans to N-dimensional spaces. It is a multidimensional representation used by ML models and neural networks to make decisions, enabling hierarchical nearest-neighbor search patterns.
Approaches to Creating Vector Embeddings
There are two approaches you can consider when creating vector embeddings:
Feature Engineering: In feature engineering, you use domain knowledge to manually quantify and assign feature values for creating vectors. While detail-oriented, this method is labor-intensive and expensive.
Deep Learning: This approach helps train the ML models to automatically convert data points (objects) into vectors. The method’s benefits include scalability and the ability to handle complex data structures.
Using Pre-Trained Models to Create Vector Embeddings
Pre-trained models are models trained on very large datasets that transform data like text, audio, and images into vector embeddings. The embeddings created by these models serve as inputs to custom models or vector databases, simplifying the initial steps of many machine-learning tasks.
For textual data, you can use word embedding models like Google’s Word2Vec or Stanford’s GloVe to train a model from scratch to generate embeddings. On the other hand, architectures like ImageNet or ResNet are useful for image data.
Challenges in Handling Vector Embeddings
Although vector embeddings are useful in implementing various NLP tasks, they are not without their challenges. You must address these issues to ensure the effectiveness of your applications.
Here are some of the challenges you might encounter when handling vector embeddings:
Quality of Training Data: When you train a model to generate vector embeddings, the outcome relies on the quality of the training data. If the data is biased or incomplete, the generated embeddings can be skewed or inaccurate.
Context Ambiguity: Without enough context, an embedding model may struggle to capture the intended meaning accurately, leading to ambiguity. For example, the word “bat” can refer to an animal or sports equipment. This lack of clarity can lead the model to produce incorrect vector representations, complicating language understanding and data processing.
Managing High-Dimensional Space: Managing high-dimensional vector space can be computationally demanding. As the datasets grow, the complexity of handling the vectors increases with the increase in the number of dimensions. Optimizing algorithms and advanced techniques become essential to handle the intricacies of the data.
Maintaining Embedding Models: The spoken language is dynamic, with new words and phrases constantly emerging and meanings evolving. Embedding models must be regularly updated to reflect these changes. The process of ensuring that models remain aligned with the current language usage requires continuous ongoing effort, resources, and time.
Applications of Vector Embedding
Vector embeddings are efficient tools for a range of applications across various fields. Here are some examples of its applications:
Search Engines
Vector embeddings are used in search engines to retrieve relevant information. The embedding helps search systems to match the user query with the documents or items based on semantic similarity and return relevant outputs.
A good vector embedding example is when you input an image in Google’s reverse image search; the engine converts it into a vector representation. This vector is then used in vector search, which allows the system to locate the image’s position in an n-dimensional space. It then retrieves related images based on semantic similarity, enhancing the accuracy and efficiency of the search.
Recommendation Systems
Recommendation systems utilize vector embeddings to capture user preferences and the characteristics of items they like. By matching these embeddings to similar products, systems can recommend new items to users.
For example, Netflix’s recommendation systems use vector embeddings to represent the features of movies or shows, as well as user watch history and ratings. The system then uses semantic similarity search to compare the user’s vectors with the movie vector, identifying embeddings closer in a vector space. This allows the system to suggest content that the user might like.
Anomaly Detection
The anomaly detection algorithms optimize the use of vector embeddings to spot unusual patterns or outliers in data. These algorithms are trained on embeddings representing normal behavior. Based on distance and dissimilarity measures, these algorithms can learn to detect deviations.
Anomaly detection is particularly useful in cybersecurity, where deviation in user behavior or network traffic can signal a potential threat, data breach, or unauthorized access.
Graph Analytics
Graph analytics involves creating graph embeddings, where nodes represent entities like people, products, or other items, and edges define the relationships between nodes. These embeddings help capture the structural and relational dynamics within a graph.
For example, graph embeddings can be used in social networks to suggest potential friends by identifying similarities in user profiles. These similarities can include common connections, interests, and activities.
Conclusion
Vector embeddings play a vital role in modern machine-learning applications by transforming complex data into structured numerical representations. The ability of these embeddings to capture the meaning and semantic relationships between different data points facilitates varied use cases.
These embeddings can be used in algorithms for search engines to improve search results and accuracy. In recommendation systems, they enable precise product suggestions by aligning products with user preferences based on semantic similarities. On the other hand, in anomaly detection, these embeddings help identify unusual patterns, contributing to reliable systems.
Vector embeddings represent a significant step in creating a more intelligent machine learning system that improves operational efficiency and user experiences.
FAQs
What is the meaning of embedding vectors?
Embedding vectors, or vector embeddings, are numerical representations of complex data types, enabling machine learning models to easily understand and analyze the data.
How big are vector embeddings?
Vector embeddings can be large and complex. For instance, a vector in OpenAI can typically be as long as 1536 dimensions, where each embedding is an array of up to 1536 floating-point numbers.
Why do you need vector embeddings?
Vector embeddings are needed for processing and analyzing data in NLP tasks such as classification, clustering, language modeling, and graph analytics.
Data is generated every second across various industries in different forms and structures. Due to increased remote work and online entertainment, the amount of data created and consumed worldwide is expected to reach over 180 zettabytes by 2025.
However, the challenge isn’t predicting data growth but managing it to extract valuable insights for strategic decisions and improve business productivity. It is essential to organize various data types, such as structured, semi-structured, and unstructured data, into suitable data platforms. Understanding the key differences between these data types is the first step in this process.
This article covers structured vs semi-structured vs unstructured data differences to help you identify and manage them efficiently.
What Is Data?
Data refers to raw facts, figures, or observations collected for analysis. It can be in various forms, including numbers, text, binary formats, or other types. Before processing and analyzing data, it is crucial to identify the type of data you are dealing with.
Classifying data into structured, semi-structured, and unstructured formats helps you determine the appropriate storage, retrieval, and analysis methods. Each format has unique characteristics that influence how the data should be handled. By understanding the data type at hand, you can aggregate it effectively, ensuring that subsequent processing leads to meaningful insights. Once you have identified and stored data from multiple sources, you can transform it into actionable information for strategic decision-making.
Types of Data
Here’s a detailed information about the different types of data—structured, semi-structured, and unstructured:
Structured Data
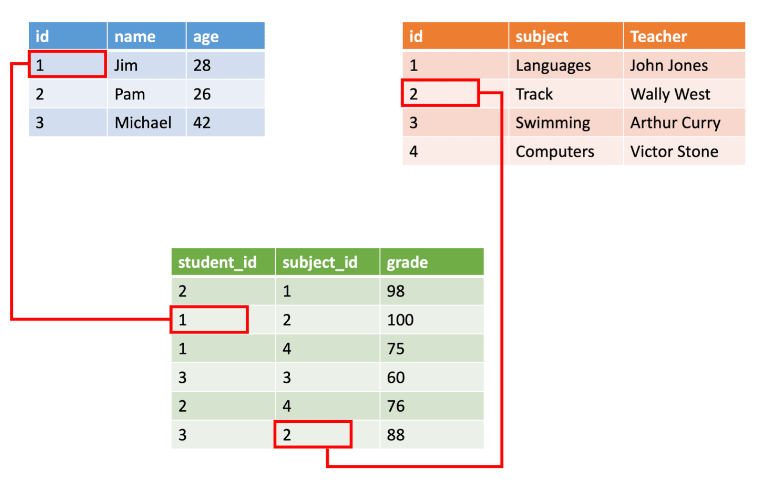
Structured data is data represented in tabular format with predefined columns and rows. It comes from various internal sources within your organization, such as customer information, financial datasets, sensor data, weblog statistics, product records, and online surveys or polls. Structured data can also be generated from outside the organization, including market research data or publicly available datasets.
To efficiently manage these structured datasets, you can use spreadsheet applications like Microsoft Excel, relational databases like MySQL, and CRM systems like Salesforce. For better analytics and reporting, you can migrate the structured data from these platforms to data warehouses like Google BigQuery or Amazon Redshift.
Once the structured data is in data warehouses, you can easily organize and query it using SQL. To extract meaningful insights from the data, you can apply various analytical techniques, such as statistical analysis, data mining, and visualization.
Use Cases
Finance: Banks and financial institutions record transactions, account balances, and customer information in a structured format for real-time reporting and fraud detection. Analyzing these structured datasets helps in credit scoring and risk assessment, enabling institutions to make better lending decisions.
Real Estate: In real estate, you can analyze structured data such as property listings, market prices, and sales histories. This analysis helps real estate agents to assess property values, predict trends, and set competitive rental rates.
Semi-Structured Data
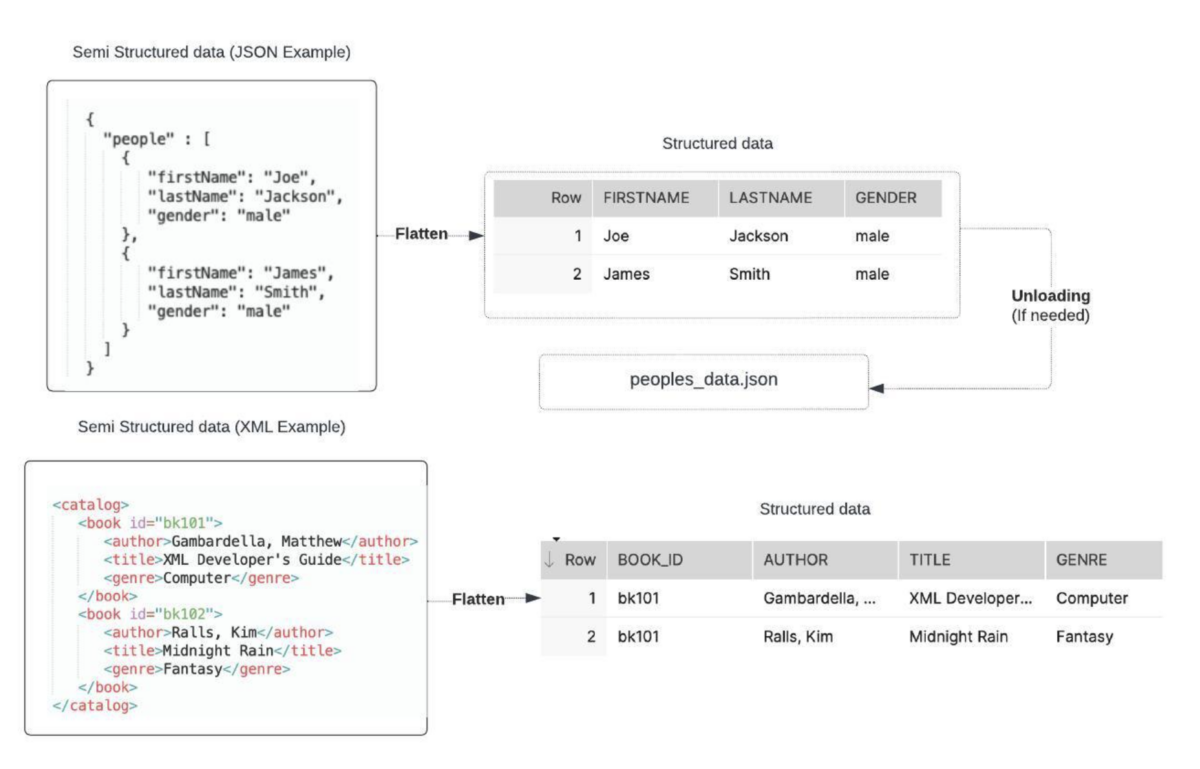
Semi-structured data is a form of information that does not conform to a rigid schema like structured data. However, it contains some organizational properties that make it easier to analyze. Unlike structured data, semi-structured data will not fit neatly into tables and rows. Instead, it often uses tags or metadata to help you separate elements.
Semi-structured data sources include graphs, emails, JSON, XML, HTML, and log files. This data type is often stored in data lakes such as Amazon S3 or Azure Data Lake Storage. After it is stored in suitable storage, you can process it using various tools like Apache Kafka, Apache Spark, or Elasticsearch.
Web Services: APIs use semi-structured data formats like JSON and XML to exchange data between web services. Since JSON and XML use a predictable structure with key-value pairs (JSON) or tags (XML), the web services can accurately interpret the data even if the exact structure varies slightly. This flexibility also helps the API scale and adapt to new data requirements without redesigning the entire schema.
Content Management System (CMS): This system allows you to use metadata and tags in the semi-structured data from blog posts and articles to improve content personalization. Using these semi-structured fields, the CMS can help you analyze user behavior or preferences, enabling your team to tailor recommendations or display content relevant to each user. Besides this, it enables you to enhance search accuracy to find content faster.
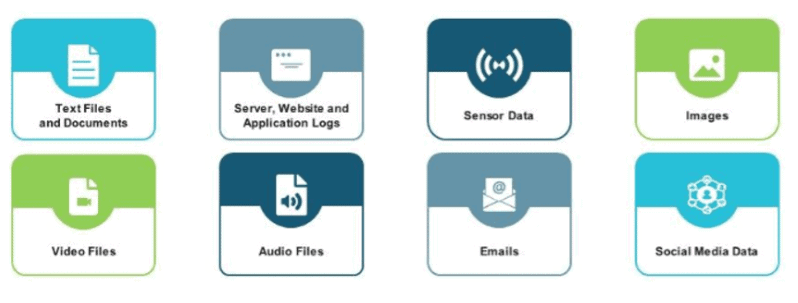
Unstructured Data
Unstructured data refers to information that does not have a predefined format. It usually comes from sources like text-based documents, images, videos, and audio and can be stored in data lakes like Google Cloud. Analyzing unstructured data can be challenging since it is unorganized and comes in many forms. Vector databases are increasingly valuable in this process for handling large and complex unstructured datasets. These databases allow you to store data as numerical vectors, enabling fast similarity searches and pattern recognition.
To make sense of unstructured data stored in Google Cloud or vector databases, tools like natural language processing (NLP), machine learning, and big data analytics are essential. These tools allow you to analyze and derive insights from unstructured data types by identifying key patterns and understanding contextual meaning. Using these analytical insights, you can predict future trends and make decisions.
Use Cases
Sentiment Analysis: You can analyze customer reviews and social media posts to assess public opinions about the products or services. This analysis can directly lead to more targeted product improvements, enhanced customer service, and improved marketing strategies.
Medical Imaging: Healthcare professionals can analyze the unstructured data from medical images using machine learning. This helps them in more accurate diagnostics and personalized treatment planning.
Structured, Semi-Structured, and Unstructured Data: A Quick Tabular Comparison
Features
Structured Data
Semi-Structured Data
Unstructured Data
Data Organization
Well organized in rows and columns.
Partially organized
Unorganized
Storage Requirements
Requires less storage space.
Generally, you need moderate storage space as it includes metadata and may have varying formats.
Demands high storage space because it can be in diverse formats.
Insight Quality
Provides clear, quantitative insights that are easy to interpret.
Offers moderate insights that can reveal trends and relationships.
Enables rich qualitative insights that capture rich context.
Data Processing
You can efficiently process structured data using SQL.
Requires parsing for queries.
Advanced analytical techniques are required to process unstructured data.
Scalability
Difficult to scale due to fixed schema.
More scalable than structured data but less than unstructured.
Easy to scale as it is schema-independent.
Transaction Management
Support transaction and concurrency mechanisms.
Transaction handling is still in the development phase, and some principles have been adapted from traditional DBMS.
No transaction and concurrency control management.
Data Versioning
Using version control systems like data version control (DVC), you can maintain multiple versions of structured rows or tables over time. As a result, you can revert to the previous changes if needed.
Git, a version control system, helps you manage changes in JSON, XML, or HTML documents by storing different versions of the entire file.
Data versioning applies to the entire dataset of unstructured data. Each version of the entire dataset captures the state of the data at a specific point in time.
Data Storage Options
Relational databases and data warehouses
NoSQL databases or document stores
Object storage, file systems, and data lakes
Supported Data Types
Numeric, text, and dates
JSON, XML, and HTML
Text, images, audio, and video
Final Thoughts
You have learned the differences between structured, semi-structured, and unstructured data. Structured data is best for applications that require strict organization and quick query responses. Semi-structured data facilitates schema adaptability while maintaining some organization.
Conversely, unstructured data, which supports various formats such as text, images, and videos, presents limitations and advantages. While it is harder to analyze, you can extract rich insights from unstructured data through advanced techniques like ML and NLP. In the end, the choice of data type depends on your projects.
FAQs
How do I choose structured vs unstructured data?
Structured data is better if you require precise calculations, aggregations, or JOIN operations. Conversely, unstructured data is appropriate if your analysis is focused on understanding sentiment, trends, or themes from sources like text, images, videos, or audio.
Can semi-structured data be converted into structured data?
Yes, you can convert semi-structured data into structured data through a parser.
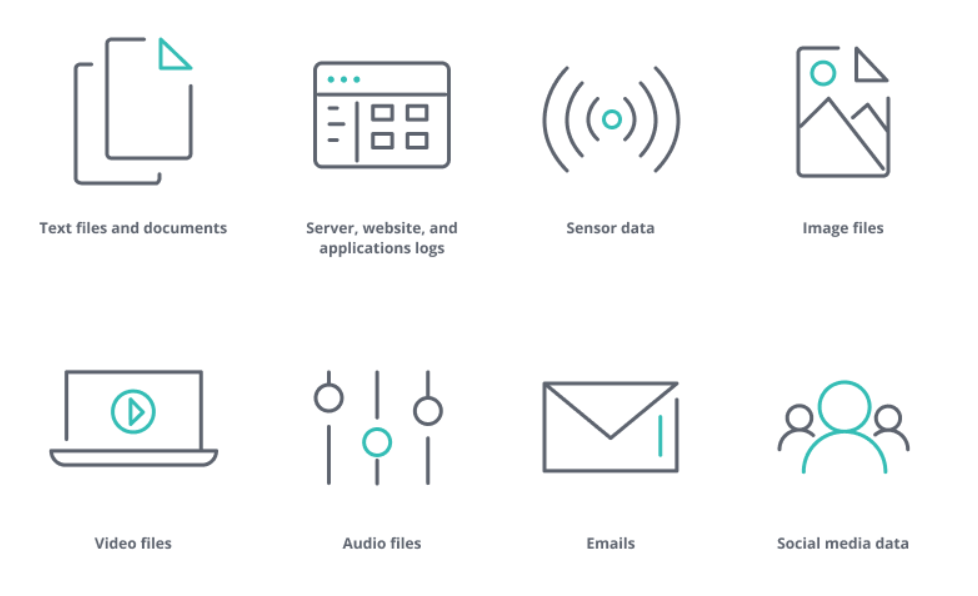
The rapid digitization of processes across industries has led to an exponential increase in the quantity and complexity of data generated. Advancements in technology, including high-resolution cameras, sensors, and IoT devices, have also contributed to the data growth. This diverse data, which includes formats like text, images, videos, and audio, is categorized as unstructured data.
Processing such data is complex and requires a modern tech stack to extract relevant insights and apply them in use cases to simplify downstream tasks. Conventional data management systems struggle to handle the volume, variety, and velocity of modern data. This is where vector databases come into play.
Vector databases are designed to help you store and retrieve high-dimensional data efficiently, making them ideal for managing unstructured information. This guide will provide you with a detailed explanation of unstructured data processing in vector databases.
Unstructured data refers to data that doesn’t follow a pre-defined format, structure, or schema. It includes varied information types such as text, images, videos, social media posts, and emails. Unlike structured data, unstructured data doesn’t have a consistent format or relationship between its components. This makes it difficult to extract invaluable insights directly from the data.
To perform unstructured data processing, you require advanced techniques like machine learning models, text mining, and natural language processing. By utilizing these methods, you can discover hidden trends, relationships, and patterns crucial for making informed decisions, improving customer experiences, or driving innovation.
Common Challenges with Processing Unstructured Data
The lack of standardization in unstructured data can cause issues when you try to process it. Some of the common challenges that you might experience include:
Data Quality and Consistency: Unstructured data has poor data quality due to inconsistencies, noise, irrelevant information, errors, and missing data points. This can significantly compromise the accuracy and reliability of any analysis or insights derived from such data.
Lack of Metadata: Unlike structured data, unstructured data has limited or no metadata available. This makes categorizing, organizing, searching, indexing, and retrieving data more complex and time-consuming.
Scalability and Storage: The volume and diversity of unstructured data keep increasing exponentially. To accommodate and process it effectively, you need modern infrastructure that supports scalable storage and high computational resources, which can be expensive.
Security and Privacy Concerns: Unstructured data can contain sensitive information, making it vulnerable to security breaches and privacy violations. This necessitates compliance with relevant data protection regulations and implementing security measures to protect data.
Comprehensive Guide on How to Process Unstructured Data
Unstructured data processing in vector databases is a complex process that requires transforming data into numerical representations suitable for vector search and analysis. This involves tasks like feature extraction, vectorization, applying similarity search algorithms, and more.
Below is a detailed guide that covers all the steps from unstructured data extraction to deriving actionable insights.
The first step involves identifying your project goals, collecting the necessary data, and loading it into repositories like data lakes or warehouses. There are several ways of extracting unstructured data, including Optical Character Recognition (OCR), web scraping, and log file parsing. You can also access data via ETL/ELT tools and APIs.
Once you’ve gathered all the relevant information, you must clean this raw data to remove anomalies and duplicates. This eliminates any data points that can introduce bias into the downstream analysis.
For textual data, you can implement tokenization (breaking text into discrete words or phrases), stemming (reducing words to base form), and lemmatization (resolving words to their dictionary form) for pre-processing. Tools like NLTK, spaCy, and Pandas can help with this.
Meanwhile, for images or videos, you might require operations like resizing, cropping, grayscaling, and applying filters or contrast enhancements. You can use libraries like OpenCV and Pillow for this.
Creating Vector Embeddings
Once the data is cleaned and prepared, the next step is to convert it into a machine-readable format. Vector embeddings help convert complex data (text, images, audio, and videos) into numerical representations, enabling machines to process this data further.
You can use Word2Vec, GloVe, and BERT to capture semantic and syntactic relationships between words. These models can map words, phrases, and documents to dense vectors, resulting in word embeddings, sentence embeddings, and document embeddings. Similarly, you can use TensorFlow’s YAMNET model to generate audio embeddings.
For images, convolutional neural networks (CNNs) like ResNet50 or VGG16 can help you extract feature vectors. You can also use multimodal models like VisualBERT and CLIP. These models convert pixel data into feature vectors that represent patterns like edges, textures, and shapes.
After creating vector embeddings that represent the essential features of your unstructured data, you store them in vector databases for analysis.
Indexing Vectorized Data
Indexing large datasets of vector embeddings involves organizing high-dimensional vectors to facilitate efficient similarity searches. It is a crucial technique for applications like semantic search, recommendation systems, and anomaly detection.
The most common method used for indexing is implementing the Approximate Nearest Neighbor (ANN) algorithm using the Facebook AI Similarity Search (FAISS) library. However, you can also leverage other algorithms like kd-trees and ball trees. These algorithms use metrics such as cosine similarity, dot product, or Euclidean distance to measure the similarity between two vectors.
Some of the indexing strategies that you can utilize include:
Local Sensitive Hashing (LSH): LSH is a technique that allows you to map similar vectors to the same hash buckets. By hashing query and database vectors, LSH significantly reduces the search space, making it efficient for ANN searches.
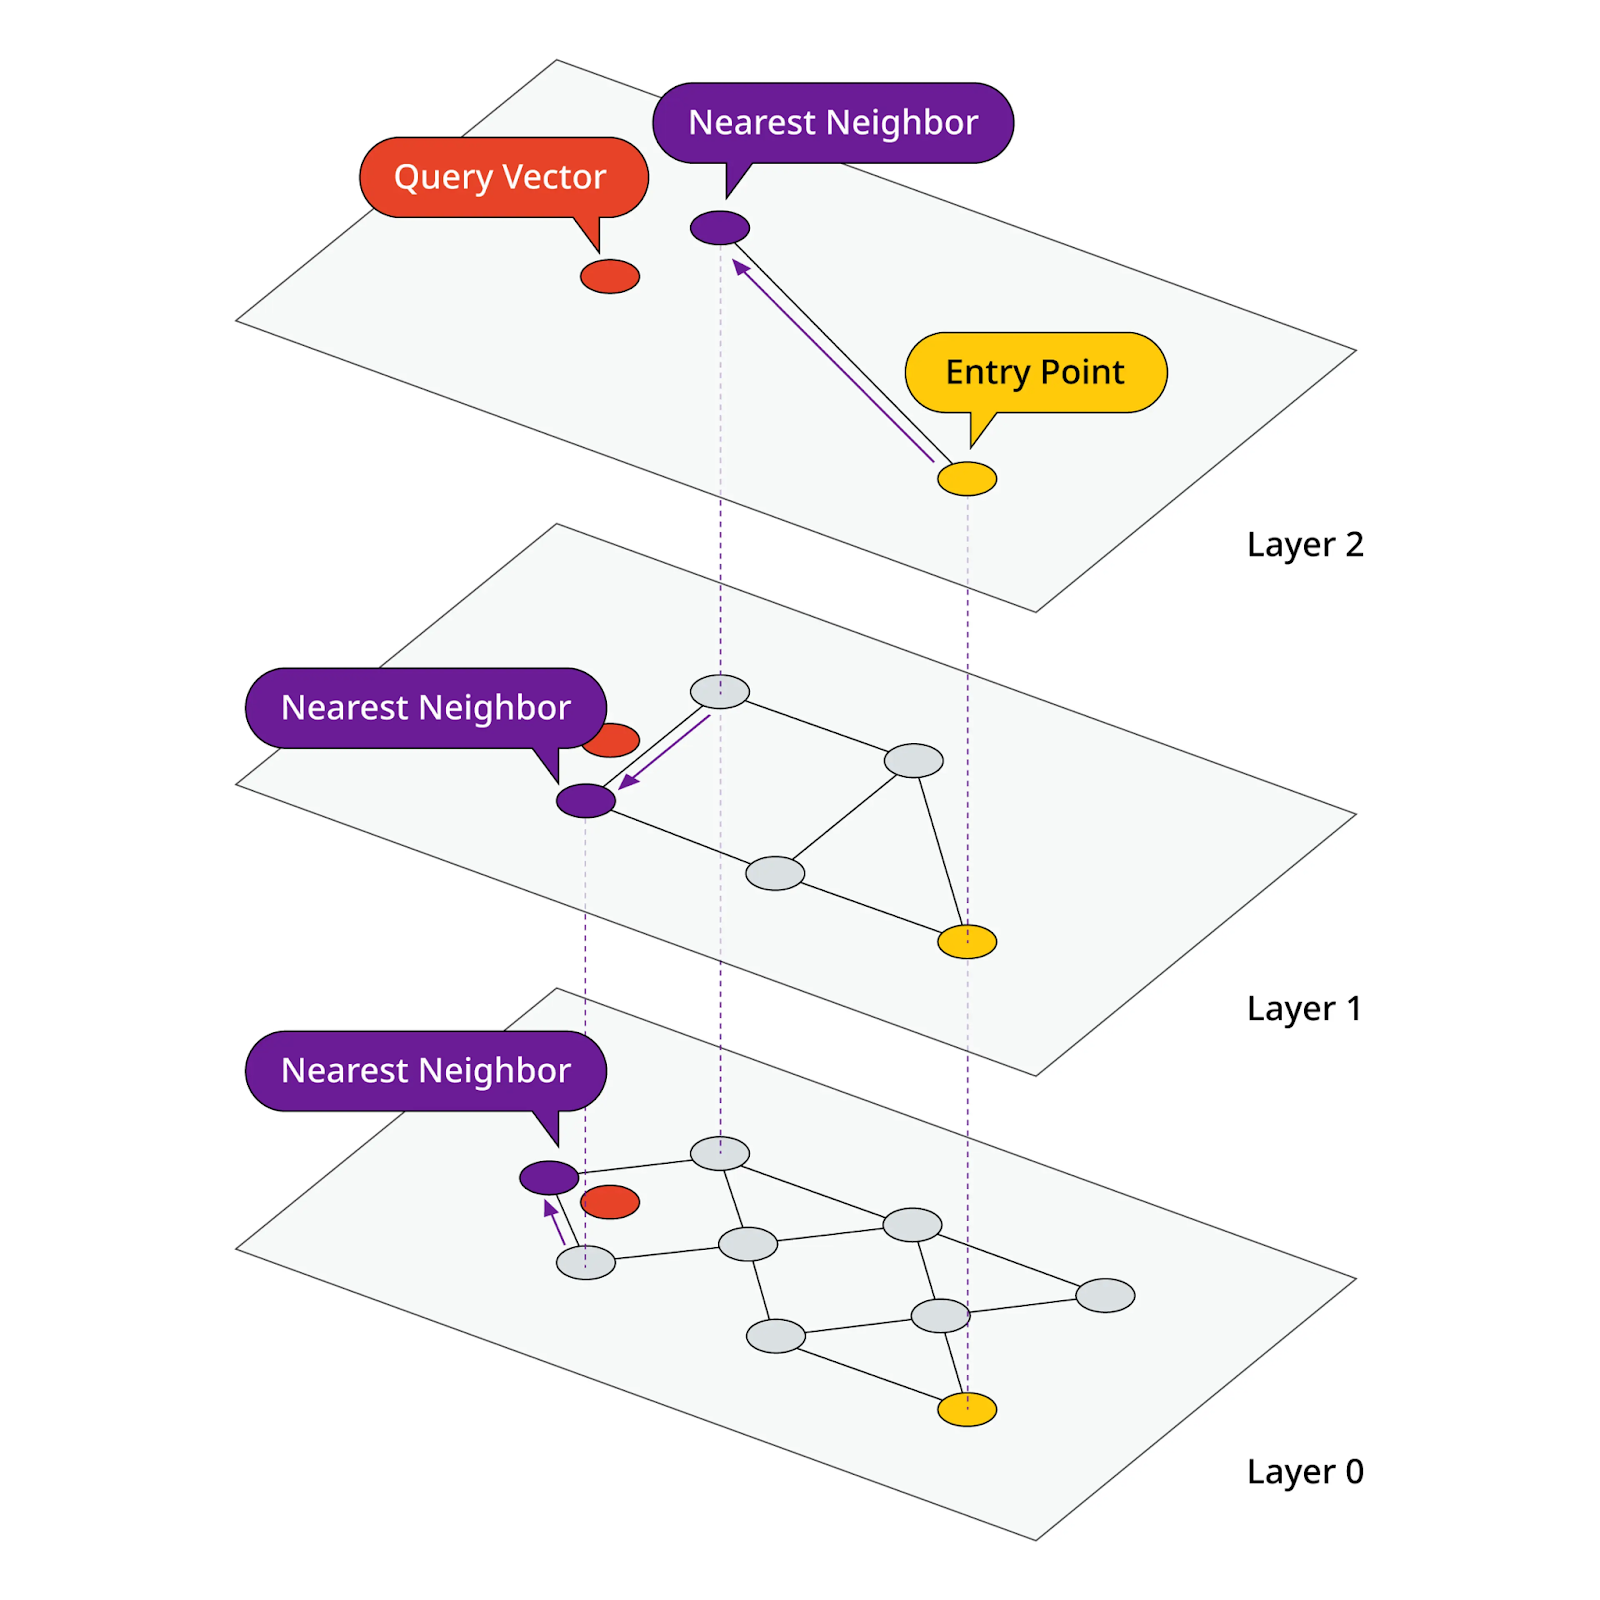
Hierarchical Navigable Small Worlds (HNSW): HNSW organizes vectors in a hierarchical structure, where every node represents a group of similar vectors. This hierarchical structure enables efficient navigation and search, making it suitable for large-scale datasets.
Flat Indexing: In flat indexing, you store all vectors in a single list without any structural modifications. While simple, it can be inefficient for larger datasets as it requires a linear search to find nearest neighbors.
Inverted File (IVF) Indexing: Through IVF indexing, you divide the dataset into multiple subsets (vector spaces). Then, assign each vector to one or more vector spaces based on its similarity to cluster centers. This reduces the search space and improves search efficiency, especially for large datasets.
Depending on your database’s scale and computational resources, you should choose the best-fitting strategy that provides quick data access and simplifies the querying process.
Querying and Performance Optimization
Once you have set up your system for unstructured data extraction, vector embedding generation, and indexing, you can begin the querying process. The query you send to the vector database through an LLM application undergoes the same process and results in a query vector. This is compared to the stored vector embeddings to find the most relevant responses.
You can track the query performance using metrics such as F1 score, precision, recall, and mean reciprocal rank and analyze if you can optimize it further. The common methods for fine-tuning the query performance include:
Dimensionality Reduction: You can use techniques like Principal Component Analysis (PCA) and t-SNE to reduce the dimensions of vectors while preserving the relationships between data points. This method enhances performance by minimizing the computational burden of comparing high-dimensional vector comparisons.
Parallel Processing: When working with large datasets, distributing the workload into smaller subtasks and executing them concurrently across multiple nodes enables faster retrieval. You can implement parallelism by leveraging parallel indexing and parallel query execution.
Data Distribution: Data distribution involves partitioning data across multiple nodes or servers so that each node is responsible for processing a subset of vectorized data. This strategy improves query performance and overall system responsiveness by ensuring proper load balancing. You can implement data distribution and achieve fault tolerance using techniques like sharding, partitioning, or replication.
Caching: You can utilize caching mechanisms for frequently executed queries and improve performance by storing the pre-computed results. For any similar queries, the system can quickly return the cached result without reprocessing the entire query again.
By applying these optimization techniques, your vector database can efficiently handle several queries at a time.
Use Cases of Unstructured Data Processing
With unstructured data processing, you can extract valuable insights and support several real-world applications. Here are some key use cases:
Customer Sentiment Analysis: You can analyze unstructured data from social media posts, customer reviews, and surveys to get a general sense of your customers’ sentiments and preferences. Natural Language Processing (NLP) techniques can help understand consumer behavior, improve products, and enhance your customer service strategies.
Recommendation Systems: Platforms like Netflix or Amazon process unstructured data such as browsing history, user interactions, and purchase behavior to personalize recommendations. These companies utilize machine learning models to analyze data and provide relevant product or content suggestions, improving user experience and engagement.
Fraud Detection: Unstructured data processing helps financial institutions to monitor transaction logs and identify fraudulent activities. By leveraging anomaly detection algorithms, organizations can block suspicious accounts and take other precautionary measures before irreversible damage occurs.
Wrapping It Up
Unstructured data processing is a powerful tool that can help you gain invaluable insights and a competitive edge. This article explores how using vector databases and advanced techniques like ML and NLP to analyze high-volume, complex data can benefit you.
To process unstructured data in vector databases, you can use vectorization, indexing, querying, and performance optimization strategies. This enables you to make informed business decisions and increase your profitability by capitalizing on the information you obtain.
FAQs
Can you store unstructured data in a database?
Yes, you can store unstructured data in No-SQL databases, data lakes, and data warehouses.
How is unstructured data like images, PDFs & videos transformed into structured data?
Unstructured data, such as images, PDFs, and videos, is transformed into structured data using feature extraction techniques. You can use OCR to extract text from images and PDFs, while computer vision helps analyze visual content in images and videos.
What are some strategies to support the general storage and retrieval of information from unstructured data?
For better data storage and retrieval of information from unstructured data, some of the effective strategies include creating vector embeddings, indexing, normalization, and adding metadata.
Machine learning models are one of the major contributors to the advancement of artificial intelligence technologies. By enabling systems to learn from data and predict outcomes with utmost accuracy, these models have become crucial for organizational growth. Machine learning models are critical in automating decision-making and enhancing predictive analytics.
These models serve as mathematical frameworks that help computers interpret complex datasets and identify patterns that would be difficult to recognize. By leveraging ML models, your organization can adapt to changing scenarios and make decisions based on data rather than intuition.
This guide offers insights into what machine learning models are, including their types, benefits, and use cases.
What are Machine Learning Models?
Machine learning (ML) models are a type of mathematical model designed to learn from data through specific algorithms. You can train the model by providing it with data and applying an algorithm that enables it to reason and detect relationships within the data.
After the initial training phase, you test the model using new unseen data to evaluate its performance. This evaluation phase tells you how well the ML model generalizes its knowledge to new scenarios, helping adjust the parameters to improve its accuracy.
For example, let’s say you want to build an application that recognizes user emotions based on their facial expressions. You can start by training a model with images of faces, each labeled with an emotion, such as happy, sad, angry, or crying. Through training, the model will learn to associate specific facial features with these emotions. You can then evaluate its performance to see if it predicts emotions accurately and identify any areas that need further refinement. After thorough evaluation and adjustment, you can use this model for your application.
What are Different Types of Machine Learning Models
There are many different types of machine learning models that can be classified into two different categories based on how they are trained.
Supervised Learning
In supervised learning, you train the model on labeled data, which is the data annotated with known outputs (labels). The model is provided with both the input and its corresponding output dataset. In the training phase, the model learns about different relationships between the input and output, minimizing the error in its predictions. Once the training is complete, you can evaluate the model using new data (testing dataset) to see how accurately it predicts the output.
Here are the two different types of supervised learning models:
Regression Model
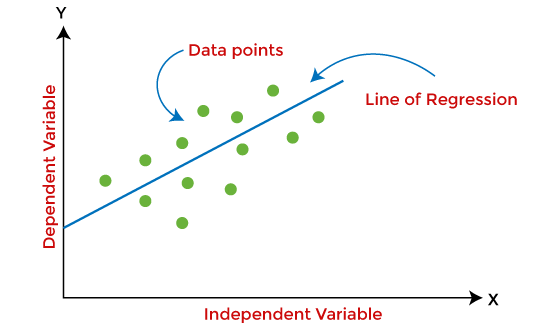
Regression in supervised learning is used to analyze the relationship between a dependent variable (what you want to predict) and an independent variable (factors influencing the prediction). The main objective is to find how any changes in an independent variable affects the dependent variable.
For example, if you are predicting a house’s price based on factors like location and size, the regression model helps you establish a relationship between these factors and price. The relationship will help you quantify how much each factor contributes to the price. This model is mainly used when the output is a continuous value.
Terminologies you need to understand
Response Variable: Also known as the dependent variable, it is the primary factor that you want to predict.
Predictor Variable: Also known as the independent variable, it is the variable used to predict the response variable.
Outliers: Outlier data points significantly differ from the other points in a dataset. Their values are either too high or low compared to other points. Because of the difference, the analysis can get skewed and lead to inaccurate results, so outliers need to be handled carefully.
Multicollinearity: Multicollinearity occurs when there is a high correlation among the independent variables. For example, when predicting house prices, the number of rooms and square footage as independent variables might be correlated since larger houses tend to have more rooms. The correlation makes it difficult for the model to determine the individual effect of each variable on the price.
Types of Regression Model
Linear Regression: This is the simplest form of regression, where the relationship between the input and output variable is assumed to be linear. The value of the dependent variable changes linearly with the independent variable, making a straight line.
The relationship can be defined using the following equation:
Y= bX+c
In the above equation:
Y is a dependent variable
X is the independent variable
b is the slope indicating the change
c is the intercept that defines the value of Y when X=0.
For example, if you are predicting the salary of an individual based on experience, then the variable for salary is dependent; the salary increases with the increase in experience.
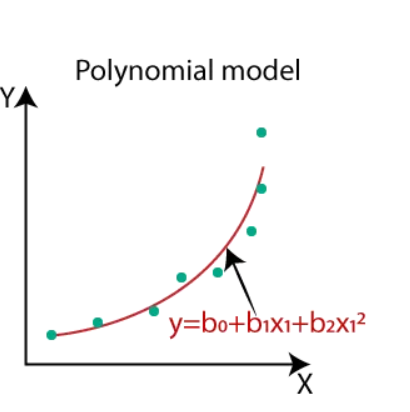
Polynomial Regression: Polynomial regression defines the relationship between input and output variables by an n-degree polynomial equation. This model is used to capture more complex patterns that don’t fit a straight line. The additional terms allow the model to capture intricate relationships among variables, making it capable of fitting to curves or other complex patterns.
A polynomial equation might look like this:
Here,
y is dependent
x is independent
b0, b1, etc., are coefficients that the model learns
An example of polynomial regression is if you want to predict a salary based on years of experience. At first, the salary may increase with years, but after reaching a certain level, the salary factor may slow down or plateau.
Classification Model
Classification in supervised learning is used to categorize new data into predefined categories based on the training dataset the model has been previously exposed to. The model learns from labeled data, where each data point is associated with its corresponding label.
Once the training is complete, the model can be tested on new data to predict which category it belongs to. For example, a category may include binary outcomes like Yes or No, 1 0r 0, as well as multi-class outcomes like Cat, Dog, Fruit, or Animal.
In classification models, a function maps the input variable to discrete outputs. The function can be represented mathematically as:
y = f(x)
Here:
y denotes the output
f is the function
x represents the features of the input variable
Types of Classification Models
Logistic Regression: This is the type of model that is used for binary classification tasks. You can optimize this model to predict the categorical variables where output is either Yes or No, 1 or 0, True or False, etc. For example, this model can be used in spam email detection, where it classifies incoming emails as either spam (1) or not spam (0).
Support Vector Machine (SVM): The SVM model helps to find the hyperplane that separates data points of one class from another in high-dimensional space.
A hyperplane can be defined as a decision boundary that maximizes the margin between the nearest points of each class. The data points closest to the hyperplane are support vectors, which are crucial for defining the hyperplane. SVM focuses on the support vectors rather than all data points to make predictions.
Unsupervised Learning
In unsupervised learning algorithms, the model is trained on unlabeled data; there are no predefined labels or outputs. The main objective of the model is to identify patterns and relationships within the data. It works by learning from the inherent features of the data without the need for external guidance or supervision.
The main types of unsupervised learning models include:
Clustering: It is the type of unsupervised learning where the model groups data points based on their similarities. The model forms homogeneous groups from a heterogeneous dataset using similarity metrics like cosine similarity. For instance, you can apply clustering to enhance customer segmentation, grouping customers with similar purchasing habits.
Association: Association is a rule-based approach that identifies relationships or patterns among various items of large datasets. It works by finding frequent itemsets and drawing inferences about associations between them. For example, an association model can be used to analyze customer purchasing patterns. The model can help you identify that customers who buy bread are likely also to purchase butter. This insight can be useful for building useful product placement strategies.
Decision Tree Model of Machine Learning
Decision tree is a predictive approach to machine learning. It operates by repeatedly splitting the dataset into branches or segments based on specific conditions in the input data. Each split helps to separate data with similar characters, forming a structure that resembles a tree.
Structure of a Decision Tree
Root Node: It represents the entire dataset and initiates the decision-making process.
Internal Node: An internal node represents a decision point where the data is split further based on attributes.
Branch: Each branch represents the outcome of a decision and the path that leads from one decision to another.
Leaf Nodes: These are the endpoints or terminal nodes of the tree where the final prediction is made.
How Does a Decision Tree Work?
A decision tree works by breaking down a dataset into smaller subsets based on some specific conditions (questions) about input features. At each step, the data is split, and similar outcomes are grouped. The process continues until the dataset can’t be split further, reaching the leaf nodes (where final predictions are made).
Reinforcement Machine Learning Model
A reinforcement learning (RL) model is a type of machine learning model that enables a computer system to make decisions to achieve the best possible outcomes. In this model, an agent learns to make a decision by interacting with the environment. The agent takes actions to achieve a goal and receives feedback in the form of rewards or penalties based on the actions. RL model’s main objective is to learn how to maximize the cumulative reward over time.
For example, you can optimize your pricing strategy using RL machine learning models based on customer behavior and market conditions.
Agent: The pricing algorithm acts as the agent, helping make real-time decisions about product pricing.
Environment: The market landscape, including customer demand, sales data, and competitor price, represents the environment.
Action: The agent can set various price points, increasing or decreasing, or maintaining the current price.
State: It includes factors such as current demand, inventory levels, and customer engagement metrics.
Rewards: The agent can receive a positive reward for increased sales or a negative reward for decreased sales.
After a few iterations, you learn about customer buying patterns and can identify the optimal pricing strategy that maximizes revenue while remaining competitive.
Practical Use Cases of Machine Learning Models
The following are some practical examples that demonstrate the impactful use of machine learning in various applications across different industries.
Recommendation Systems
Many big retailers, such as Amazon and Flipkart, or streaming platforms like Netflix, use ML-powered recommendation systems to analyze users’ preferences and behavior. Through content-based filtering, these systems aim to enhance customer satisfaction and enhance engagement by providing relevant product or service suggestions.
For example, let’s take a look at how Netflix recommends movies or shows. It uses ML recommendation systems to analyze what shows you have watched, how long you have watched them, and what you have skipped. The system learns your habits and finds patterns in the data to suggest content you will likely enjoy, and that perfectly aligns with your taste.
Spam Email Filtering
Email services need robust systems to protect users from spam and phishing attacks. A reliable filtering system can be built using machine learning to sort relevant emails from unwanted or harmful content. The ML model analyzes each email’s content, such as sender’s location, email structure, and IP address. It learns from millions of emails to detect subtle signs of spam that may be missed by rule-based systems.
For example, Google employs machine learning powered by user feedback to catch spam and identify patterns in large datasets to adapt to evolving spam tactics. The Google ML model has advanced to a point where it can detect and filter spam with about 99% accuracy. It uses a variety of AI filters that determine what mail is spam. These filters look at email characteristics like IP address, domain and subdomains, and bulk sender authentication. The ML model also optimizes user feedback to improve the filtering process, where it learns from patterns like when a user marks spam for a certain email in their inbox.
Healthcare Advancements
Machine learning models can help analyze complex medical data such as images, patient histories, and genetic information. This can facilitate early disease detection, enabling timely medical interventions.
For example, machine learning models can help healthcare providers detect early signs of cancer in medical images like MRIs and CT scans. These models help to identify minute details and anomalies in the images that the naked eye can overlook. The more accurate the detection, the more accurate the diagnosis.
Predictive Text
Predictive text technology enhances typing efficiency by suggesting the next word or phrase likely to be used. ML models learn from language patterns and previous inputs to predict what users will type, improving the speed and accuracy of suggestions.
For example, Google’s smart compose in Gmail is powered by machine learning, which helps you write emails faster; it offers suggestions as you enter text. The smart compose is available in English, Spanish, French, Italian, and Portuguese.
Conclusion
Machine learning models have transformed how systems or applications operate. These models simplify the processes of data analysis and interpretation, offering significant benefits across various industries, including healthcare, marketing, and finance.
There are multiple types of machine learning models, such as classification, clustering, and regression. These models continuously learn from the data, enhancing their accuracy and efficiency over time. You can employ the ML models to improve the operational efficiency of your applications, improve decision-making, and derive innovation in various business fields.
FAQs
Are AI and Machine Learning the Same or Different?
AI and machine learning are related but different. AI has a broader concept where the primary object is to develop machines that can simulate human intelligence. Whereas Machine learning is a subset of AI, involving teaching machines to learn from data. This machines improve their performance over time.
Is ChatGPT a Machine Learning Model?
Yes, ChatGPT is a machine-learning model. It is specifically a generative AI model based on the deep learning architecture known as the Transformer. This allows it to produce contextually relevant data by learning from a huge dataset of diverse information.
What is the Simplest Machine Learning Model?
Linear regression is considered the simplest machine learning model. You can use this model to predict the relationship between a dependent variable and an independent variable.
When to Use Machine Learning Models?
You can use ML models across various applications such as for building recommendation systems, filtering spam in emails or advancing healthcare with predictive diagnostics.