


Today, Tableau is one of the easiest business intelligence (BI) tools among the list of various BI tools, as it does not require any coding knowledge. Organizations use Tableau to analyze their data and generate actionable insights to make effective decisions. Tableau is a powerful tool that simplifies raw data into an understandable format. Even non-technical users can use Tableau due to its simplicity.
This article provides an overview of Tableau dashboards, features, and uses. It also explains the steps to create a dashboard in Tableau.
What is Tableau
Developed in 2003, Tableau is the world’s leading data analytics platform. Tableau is a top-rated business intelligence tool businesses use to analyze data and make effective decisions. It is popularly known for taking data from almost any source and turning it into actionable insights quickly and accurately. Working with Tableau is simple, through the dragging and dropping functionality. Tableau’s industry-leading enablement resources training and global data community provide unparalleled support for customers and their analytics investment.
Features of Tableau
a. Intuitive user experience
Tableau believes that data analytics should be asking questions, not learning about the software. With its built-in visual practices, Tableau allows limitless data exploration without interrupting the analysis flow.
b. Tableau dashboards
Tableau provides an intuitive dashboard with self-explaining wizards that allow non-technical users to create data visualizations easily. Dimensions and charts are simple drag-and-drop functions for data analysis in Tableau dashboards.
c. Data sources
The tableau consists of more than 200 connectors, which help users to connect with external data sources such as the cloud, spreadsheets, RDBMS, and more.
d. Collaborative sharing
Tableau enables users to collaborate with their teams to understand and share the analysis of data efficiently. Users can also share their data analytics reports to the cloud, which is accessible to everyone.
e. Advanced visualizations
Tableau has a wide range of visualizations using charts, tables, maps, graphs, and more. With Tableau, users can also learn and analyze data using area charts, bar charts, Bubble Cloud, heat maps, dot distribution maps, cartograms, and bullet graphs.
What is a dashboard in Tableau
Dashboards in Tableau collect different views or visualizations where each view simultaneously indicates different kinds of data. In other words, a tableau dashboard gives you a summary of various workbooks it contains that are consolidated in one place. Like excel worksheets, you can access Tableau dashboards from the tabs at the bottom of the workbooks. Data in sheets and dashboards are connected, so when you modify a sheet, any dashboards containing that sheet will change and vice versa. As a result, both sheets and dashboards will be updated with the latest available data from the source.
Most organizations use dashboards because they are highly customizable. IT can have data of all forms with different date ranges that help you to understand: what happened to your data, why it happened, and what action you can take.
Dashboards versus reports
Most businesses use dashboards and reports to understand and analyze data and make effective decisions. Reports usually provide a narrow focus, like a deep dive view into a dataset, and concrete more on a single item or event. In contrast, dashboards tend to have a high-level view of data and usually answer a single question of data. The questions can be like how was your site performing last month? Questions can be specific such as how many units did our business sell? Dashboards can also answer complex questions like is our overall efficiency improving?
What is Tableau dashboard used for
Tableau dashboards aggregate data from different sources so non-technical people can easily read and interpret them. The primary use of dashboards is to provide a comprehensive view of data from various sources. Dashboards in Tableau measure customer metrics, sales information, finance information, web analytics, manufacturing information, human resources data, marketing performance, and logistics information.
Since dashboards are highly versatile, they are used mainly by professionals or data scientists to analyze and study complex data. Stakeholders use dashboards in presentations to understand challenges, opportunities, and organizational changes.
There are some important steps that you should follow while building a dashboard.
a. Define your audience and goals
Ask yourself who you are building this dashboard for and what you need to understand from it. Once you get that, you can answer the questions quickly with selected visualizations and data.
b. Choose your data
Many businesses have large amounts of data from different sources. So in such cases, you need to choose only what is relevant to your audience and avoid confusing your audience with too much information.
c. Double-check your data
Always ensure that your data is cleaned and correct before building the dashboard. If your information is correct and you create a dashboard, you will make proper decisions for your organization.
d. Select the correct visualizations
There are many visualizations like graphs, maps, charts, and more. You can always select the one that is simple to understand but include the information your audience will understand. For example, pie charts and bar charts are simple to understand but adding too much information will make them complex.
e. Use of a template
When building the dashboard for the first time, you can use templates to save time. Select the best template for your project, and do not go for a complex template where loading and analyzing data becomes difficult.
f. Keep it simple
Refrain from adding excessive information in your dashboard, so your audience understands it. Keep it simple and easy to understand by using similar colors and fonts.
g. Iterate and improve
Once you have created your dashboard, ask for feedback from a specific person in your team or audience. Find out if it is making sense to them and answer their questions. After receiving feedback, you can analyze what went wrong in the dashboard and work on it again.
How to Create a dashboard in Tableau
Follow the below steps to create a dashboard in Tableau.
Note: The below steps are supported in Tableau Cloud, Tableau Desktop, and Tableau Server.
It is assumed that you have registered your organization on Tableau Server. After logging in to Tableau Server, follow the below steps for creating a new dashboard.
1.To create a new dashboard, you have to click on new->Workbook.
2. At the bottom of the workbook, click on the New Dashboard icon.

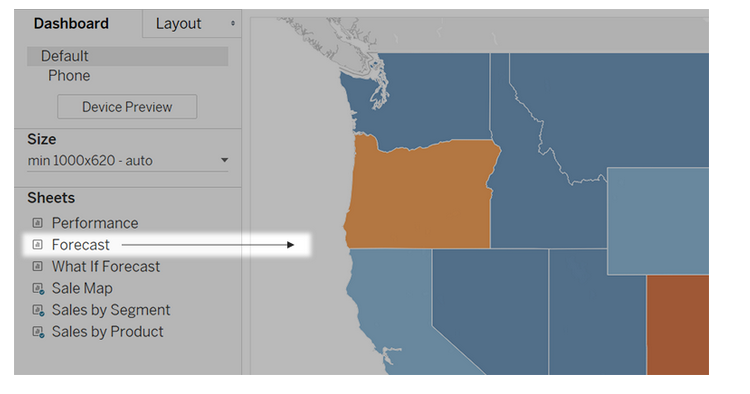
3.From the Sheets lists at left, drag views to the dashboard at right.
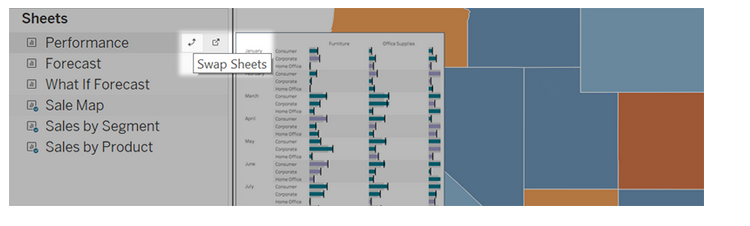
4. To replace the sheet, select it in the dashboard at the right. In the Sheets list at left, hover over the sheet that is to be replaced and then click on the Swap Sheets button.
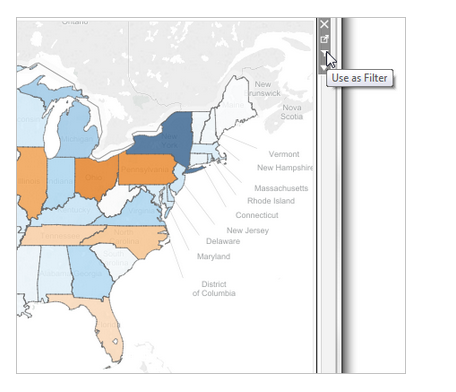
5.You can add interactivity to dashboards to improve the data insights by using the steps below.
In the upper right corner of the sheet, enable the Use as Filter option to use selected marks in the sheet as filters for the other sheets in the dashboard.
You can add actions for using multiple sheets as filters, navigating from one sheet to another, displaying web pages, and more in Tableau. For more information, you can check the actions and dashboards.
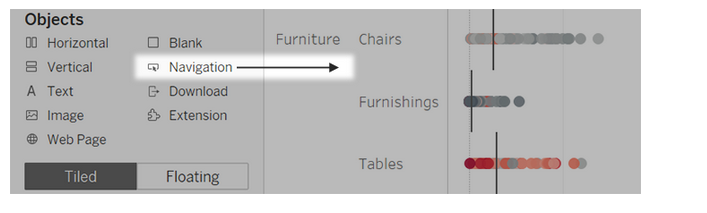
6.Adding dashboard objects and setting their options.
Along with sheets, you can add dashboard objects to add visual appeal and interactivity. You can read about the different object types.
Follow the below steps to add objects to dashboards.
a. From the Objects section on the left, you will drag an item to the dashboard on the right.
You can copy and paste objects within the current dashboard or from other dashboards in other sheets. Objects between Tableau Desktop and Online Tableau can also be copied and pasted.
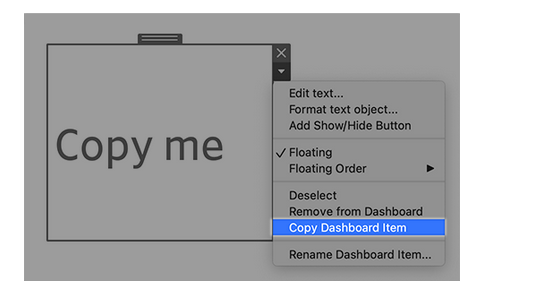
Follow the below steps to copy dashboard objects.
a. Select the dashboard object and select the Copy Dashboard Item from the object menu. Or you can also select from the main menu, select Dashboard->Copy Selected Dashboard Item.
b. Go to the dashboard where you want to paste the object. Either select nothing to paste n the upper left corner of the dashboard or select an existing item to paste next to it.
c. In Tableau Desktop, click on File->Paste. In Tableau Online, click on Edit->Paste or use the keyboard shortcut to paste.
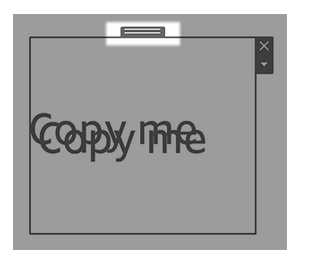
d. The object is pasted 10 pixels below and is to the right of the upper left corner of the dashboard or the selected object. To move the pasted object, drag the handle at the top.
You can also explore other important tasks in Tableau dashboards, such as setting options for objects, setting detailed options for navigation and download objects, showing and hiding objects in dashboards, and applying security options for web page objects.
Conclusion
This article discussed the Tableau dashboards along with their features and uses. You do not need any coding language to use Tableau; it is very simple, as it has drag-and-drop functionalities. Many leading organizations, such as Linkedin, Amazon, Ferrari, Cisco, Adobe, and more, have used Tableau for data reporting and visualization.